Fig. 14
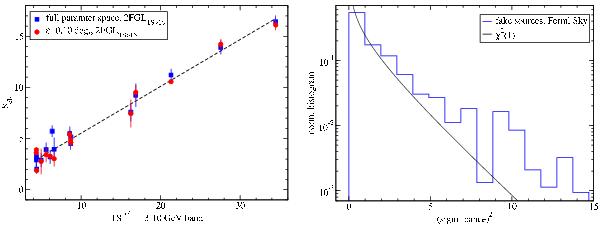
Left panel: scatter plot of
Scls vs.  .
For each source in our 2FGLTS>16 list, associated to one or more
γ-ray DBSCAN cluster, we plot the
in the 3–10 GeV band vs. the average values of Scls and
its standard deviation (represented by the error bar). Right panel:
the distribution (blue line) of the square of the significance for the fake
clusters in the Fermi-LAT real sky for the full
K, ε parameter space compared to a
χ2 distribution with one degree of freedom.
.
For each source in our 2FGLTS>16 list, associated to one or more
γ-ray DBSCAN cluster, we plot the
in the 3–10 GeV band vs. the average values of Scls and
its standard deviation (represented by the error bar). Right panel:
the distribution (blue line) of the square of the significance for the fake
clusters in the Fermi-LAT real sky for the full
K, ε parameter space compared to a
χ2 distribution with one degree of freedom.
Current usage metrics show cumulative count of Article Views (full-text article views including HTML views, PDF and ePub downloads, according to the available data) and Abstracts Views on Vision4Press platform.
Data correspond to usage on the plateform after 2015. The current usage metrics is available 48-96 hours after online publication and is updated daily on week days.
Initial download of the metrics may take a while.