Fig. 12
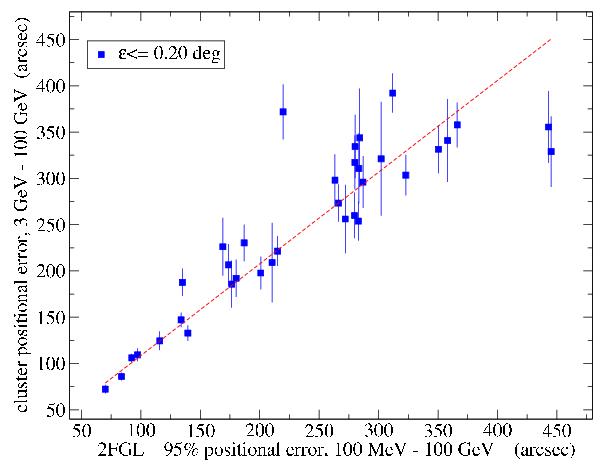
Scatter plot of the positional error of the γ-ray DBSCAN clusters vs. the positional error of the corresponding associated 2FGLTS>16 sources. For each 2FGLTS>16 source associated to one or more γ-ray DBSCAN clusters, we plot the error on the position of the reconstructed cluster centroid and its standard deviation (represented by the error bar). The dashed red line represents a linear best fit with a slope of ≃ 0.99 and an intercept of ≃ 9.53.
Current usage metrics show cumulative count of Article Views (full-text article views including HTML views, PDF and ePub downloads, according to the available data) and Abstracts Views on Vision4Press platform.
Data correspond to usage on the plateform after 2015. The current usage metrics is available 48-96 hours after online publication and is updated daily on week days.
Initial download of the metrics may take a while.