Fig. 10
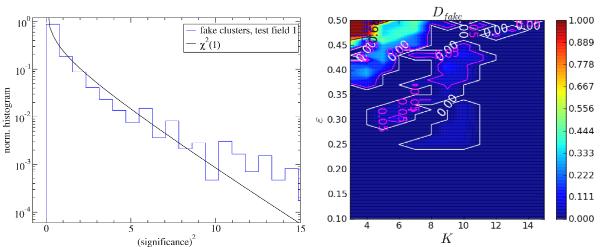
Left panel: the distribution (blue line) of the square of the significance for the fake clusters in sky test field 1 for the full K, ε parameter space compared to a χ2 distribution with one degree of freedom. Right panel: the spurious ratio Dfake for Scls > 4.0, the white line shows the isolevel Dfake = 0.0.
Current usage metrics show cumulative count of Article Views (full-text article views including HTML views, PDF and ePub downloads, according to the available data) and Abstracts Views on Vision4Press platform.
Data correspond to usage on the plateform after 2015. The current usage metrics is available 48-96 hours after online publication and is updated daily on week days.
Initial download of the metrics may take a while.