Fig. 1
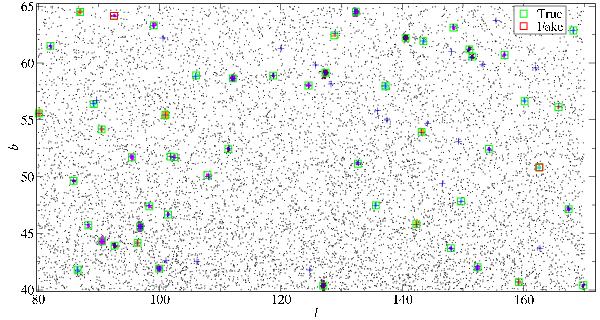
Photon map for the sky test field 1, with the result of the γ-ray DBSCAN detection for K = 5 and ε = 0.17 deg. The blue crosses refer to the simulated sources, the green boxes to 51 detected true clusters, and the red boxes to the 2 fake ones. The black dots represent the background events, the remaining colors indicate cluster events.
Current usage metrics show cumulative count of Article Views (full-text article views including HTML views, PDF and ePub downloads, according to the available data) and Abstracts Views on Vision4Press platform.
Data correspond to usage on the plateform after 2015. The current usage metrics is available 48-96 hours after online publication and is updated daily on week days.
Initial download of the metrics may take a while.