Fig. 7
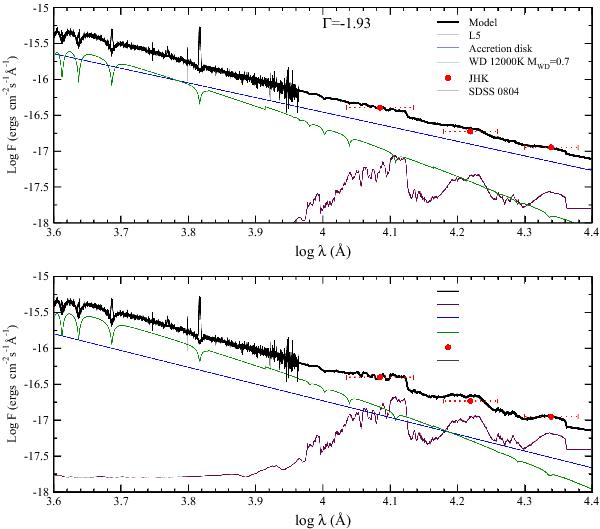
Spectral energy distribution of SDSS0804 is plotted with the components of the best-fit models. The tiny black line is the observed quiescent optical spectrum, red dots are JHK IR measurements. Overplotted with a thick black line is the sum of all components that comprise the close binary. The green line is the WD spectral model, the blue line corresponds to the accretion disk contribution, and the maroon line represents the brown dwarf spectrum. The top figure shows the solution corresponding the χ2 minimum in which the accretion disk dominates in the IR. The bottom figure presents the solution with the standard spectral index of Γ = Γ0 ≡ −7/3 ≅ −2.33 and the secondary dominating in the IR.
Current usage metrics show cumulative count of Article Views (full-text article views including HTML views, PDF and ePub downloads, according to the available data) and Abstracts Views on Vision4Press platform.
Data correspond to usage on the plateform after 2015. The current usage metrics is available 48-96 hours after online publication and is updated daily on week days.
Initial download of the metrics may take a while.