Fig. 11
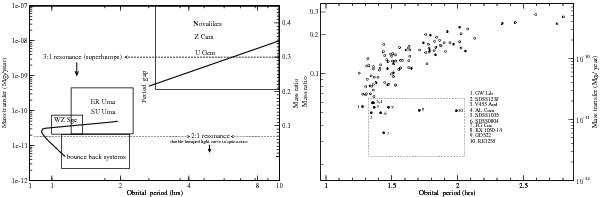
Plots of the mass ratio and the mass transfer rate vs. the orbital period of CVs. In the schema (left panel), locations of different CV types are marked along with the 3:1 and 2:1 resonance radii. The lower box in that panel corresponds to the location of bounce-back systems, as labeled. In the right panel observed systems with known parameters are plotted with the mass ratio axes marked on the left and estimated mass transfer rates on the right axes. The bounce-back candidates are enclosed in a dash-dotted box.
Current usage metrics show cumulative count of Article Views (full-text article views including HTML views, PDF and ePub downloads, according to the available data) and Abstracts Views on Vision4Press platform.
Data correspond to usage on the plateform after 2015. The current usage metrics is available 48-96 hours after online publication and is updated daily on week days.
Initial download of the metrics may take a while.