Free Access
Fig. 1
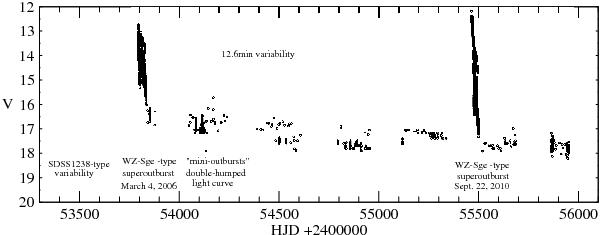
Light curves of SDSS0804 are shown from 2005 to 2012 in the V band. The plot is based on a combination of data obtained by us, including those published in Zharikov et al. (2008), and data accumulated by the AAVSO.
Current usage metrics show cumulative count of Article Views (full-text article views including HTML views, PDF and ePub downloads, according to the available data) and Abstracts Views on Vision4Press platform.
Data correspond to usage on the plateform after 2015. The current usage metrics is available 48-96 hours after online publication and is updated daily on week days.
Initial download of the metrics may take a while.