Free Access
Fig. 6
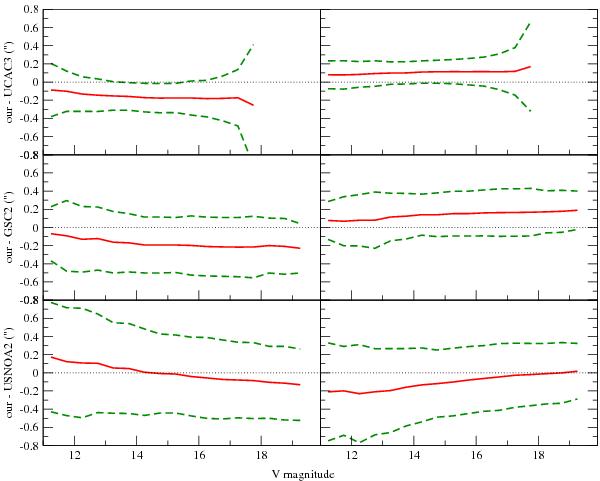
Comparison of our astrometry with those from UCAC3 (top), GSC2.3.2 (middle), and USNO-A2 (bottom). Left: differences in αcosδ. Right: differences in δ. In red, mean differences. Green dashed lines show 1σ ranges. All differences are in arcsec.
Current usage metrics show cumulative count of Article Views (full-text article views including HTML views, PDF and ePub downloads, according to the available data) and Abstracts Views on Vision4Press platform.
Data correspond to usage on the plateform after 2015. The current usage metrics is available 48-96 hours after online publication and is updated daily on week days.
Initial download of the metrics may take a while.