Fig. 4
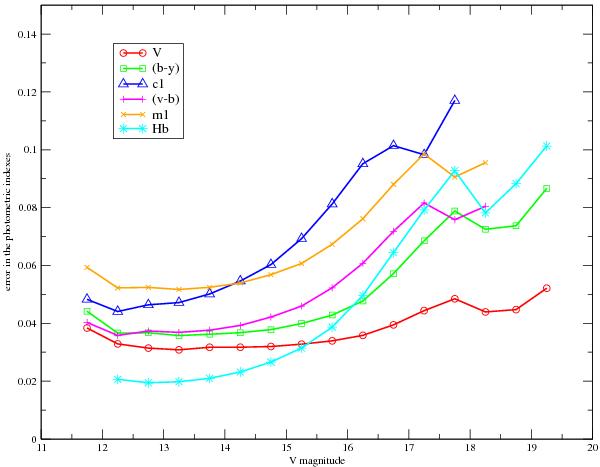
Internal photometric standard deviation computed by error propagation in Eqs. (2) and (3), as a function of V magnitude for those stars with only one measurement. Lines for the V magnitude and the five standard indexes are plotted. Bins of  are used in order to compute the mean, and inside each bin, outliers are rejected using a 5σ clipping.
Current usage metrics show cumulative count of Article Views (full-text article views including HTML views, PDF and ePub downloads, according to the available data) and Abstracts Views on Vision4Press platform.
Data correspond to usage on the plateform after 2015. The current usage metrics is available 48-96 hours after online publication and is updated daily on week days.
Initial download of the metrics may take a while.