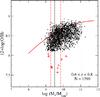
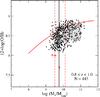
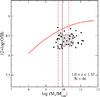
Fig. 7
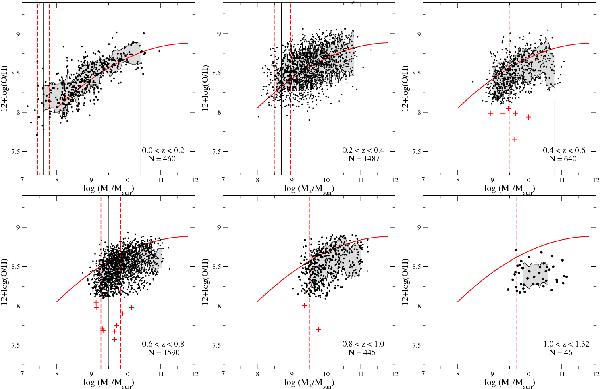
Cosmic evolution of the MZR for six different redshift bins increasing from left to right and from up to down. The red solid line shows the fit to the MZR in the SDSS data. Grey areas show the ± σ intervals to the Z medians fits in different mass bins for each redshift range. The vertical lines show the minimum masses for 25%, 50% and 75% levels of completeness. Red crosses represent low-Z objects in the sample found using ISAAC near-IR observations (Maier et al., in prep.).
Current usage metrics show cumulative count of Article Views (full-text article views including HTML views, PDF and ePub downloads, according to the available data) and Abstracts Views on Vision4Press platform.
Data correspond to usage on the plateform after 2015. The current usage metrics is available 48-96 hours after online publication and is updated daily on week days.
Initial download of the metrics may take a while.