Fig. 2
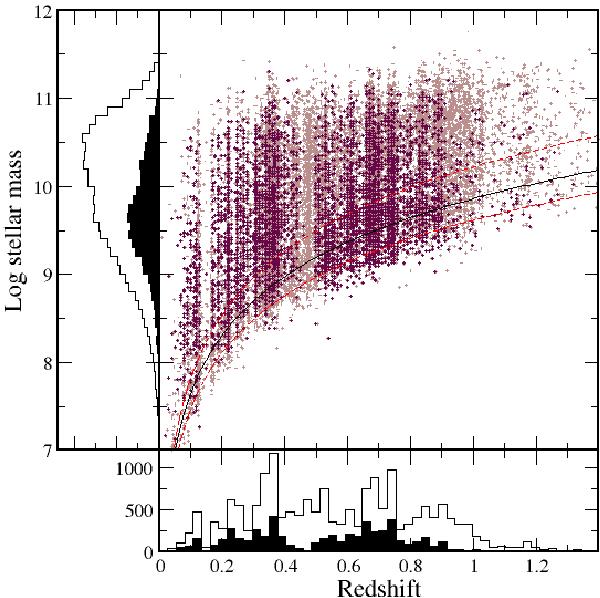
Relation between redshift and stellar mass (in solar masses) for the complete zCOSMOS 20 K sample (brown points) and star-forming selected galaxies (violet points). The solid lines show the logarithmic fitting to the limiting masses of the star-forming sample for levels 25%, 50%, and 75% of completeness. Lower and left hand panels also show the distributions for both the complete sample (empty histogram) and the star-forming galaxies (filled histogram) of z and M∗, respectively.
Current usage metrics show cumulative count of Article Views (full-text article views including HTML views, PDF and ePub downloads, according to the available data) and Abstracts Views on Vision4Press platform.
Data correspond to usage on the plateform after 2015. The current usage metrics is available 48-96 hours after online publication and is updated daily on week days.
Initial download of the metrics may take a while.