Fig. 12
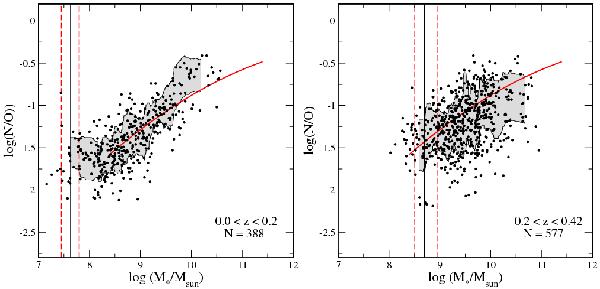
Cosmic evolution of the MNOR for two different redshift bins. The red solid line shows the fit to the MNOR in the SDSS data. Upper and lower solid lines show the ± σ intervals to the fitting to the N/O medians in different mass bins for each redshift range. The vertical lines show the minimum mass limits for 25%, 50% and 75% levels of completeness.
Current usage metrics show cumulative count of Article Views (full-text article views including HTML views, PDF and ePub downloads, according to the available data) and Abstracts Views on Vision4Press platform.
Data correspond to usage on the plateform after 2015. The current usage metrics is available 48-96 hours after online publication and is updated daily on week days.
Initial download of the metrics may take a while.