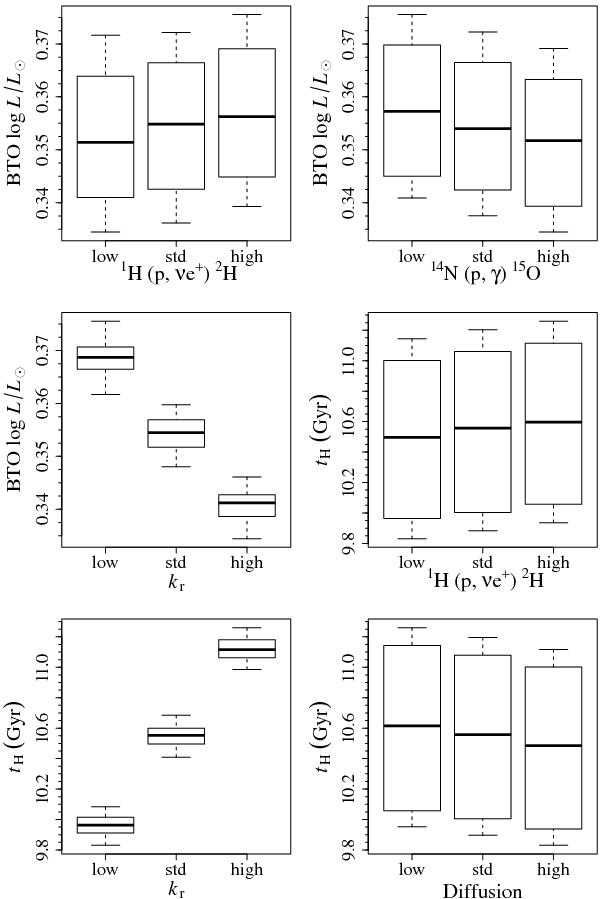
Fig. 5

Boxplot of the impact of the variation of the most important physical inputs on log LBTO and on tH. The black thick lines show the median of the data set, while the box marks the interquartile range, i.e. it extends form the 25th to the 75th percentile of data. The whiskers extend from the box until the extreme data. For each parameter pi, the labels low, std and high refer to the values 1.00−Δpi, 1.00, and 1.00 + Δpi.
Current usage metrics show cumulative count of Article Views (full-text article views including HTML views, PDF and ePub downloads, according to the available data) and Abstracts Views on Vision4Press platform.
Data correspond to usage on the plateform after 2015. The current usage metrics is available 48-96 hours after online publication and is updated daily on week days.
Initial download of the metrics may take a while.


