Fig. 1
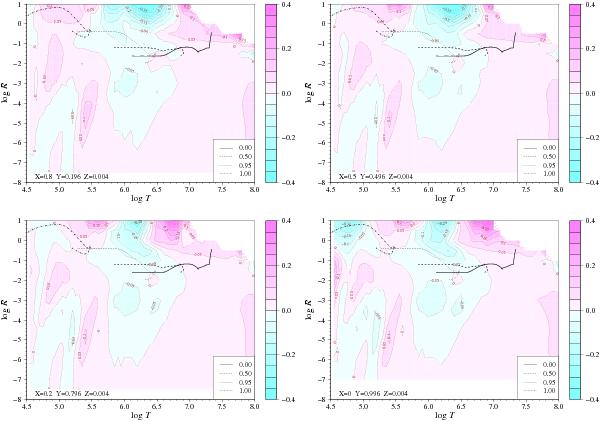
Contour plots of the difference between OPAL and OP calculations for different
hydrogen abundance X and metallicity Z = 0.004.
The temperature T is in K, while R is in
g cm-3 K-3. The colored scale marks the values of the
relative difference  . Solid
line: evolutionary path of the stellar center; dashed line: evolutionary path of
the 0.50 mass fraction of the structure; dotted line: path of the 0.95 mass
fraction of the structure; dot-dashed line: path of the 0.99974 mass fraction of
the structure, labeled as 1.00.
. Solid
line: evolutionary path of the stellar center; dashed line: evolutionary path of
the 0.50 mass fraction of the structure; dotted line: path of the 0.95 mass
fraction of the structure; dot-dashed line: path of the 0.99974 mass fraction of
the structure, labeled as 1.00.
Current usage metrics show cumulative count of Article Views (full-text article views including HTML views, PDF and ePub downloads, according to the available data) and Abstracts Views on Vision4Press platform.
Data correspond to usage on the plateform after 2015. The current usage metrics is available 48-96 hours after online publication and is updated daily on week days.
Initial download of the metrics may take a while.