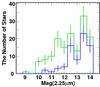
Fig. 8
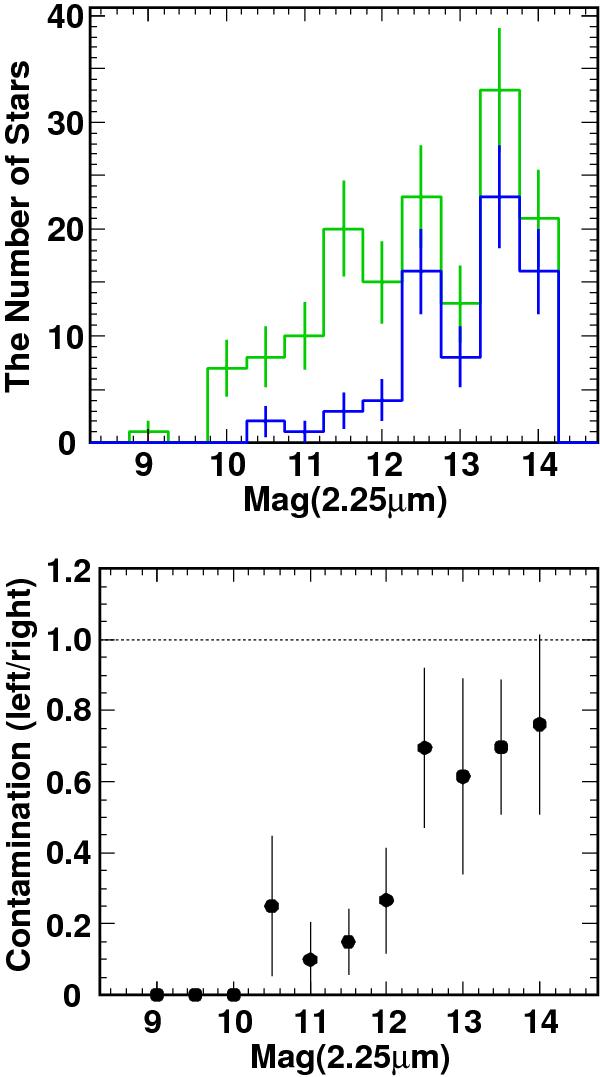
Top: magnitude histograms for early-type star candidates (green) and stars more than 2-σbluer than the RGB (see Fig. 6). This shows that the number of stars at the redder side (earlier spectral type) of the RGB is clearly larger than that at the bluer side (later spectral type). Bottom: ratio of the bluer stars to the early-type star candidates. If we assume that the bluer stars are red giants with a large photometric uncertainty, a similar number of stars may contaminate our sample of the early-type star candidates. So this diagram shows the expected ratio of such contamination for the candidates. The uncertainties in the top panel are given by the square root of the counts in each bin. For stars brighter than [2.25] = 12.25 mag, the contamination is low (≲ 25%).
Current usage metrics show cumulative count of Article Views (full-text article views including HTML views, PDF and ePub downloads, according to the available data) and Abstracts Views on Vision4Press platform.
Data correspond to usage on the plateform after 2015. The current usage metrics is available 48-96 hours after online publication and is updated daily on week days.
Initial download of the metrics may take a while.