Open Access
Fig. 7
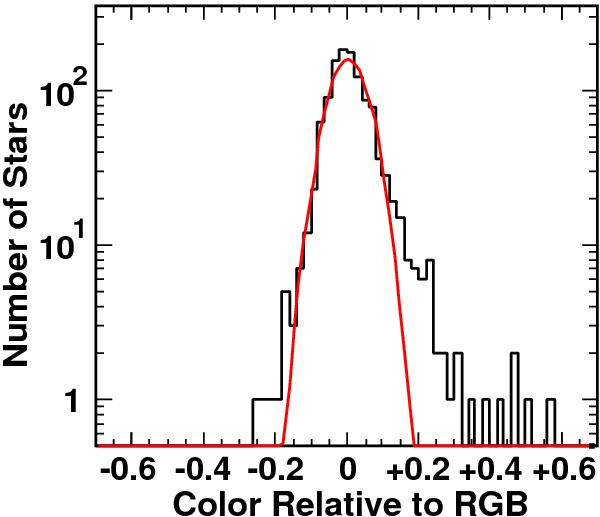
Histogram of stellar colors relative to the RGB mean (pink circles in Fig. 6). Only stars with [2.25] < 12.25 mag are used for this histogram. A Gaussian fit is shown by a red line. An excess is clearly seen on the right (redder) side of the RGB, indicating the existence of early-type stars in this region.
Current usage metrics show cumulative count of Article Views (full-text article views including HTML views, PDF and ePub downloads, according to the available data) and Abstracts Views on Vision4Press platform.
Data correspond to usage on the plateform after 2015. The current usage metrics is available 48-96 hours after online publication and is updated daily on week days.
Initial download of the metrics may take a while.