Open Access
Fig. 4
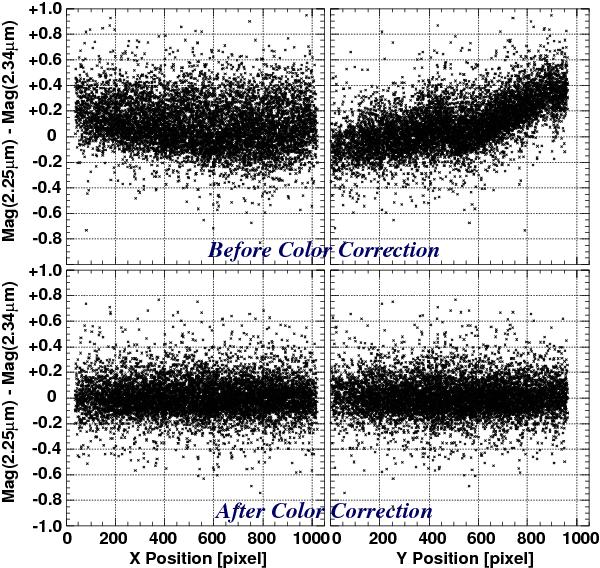
Color dependence of point sources along the x- and y-axes on the infrared array. We can see a clear color trend before the color correction (upper panels). However, after the correction (bottom panels), no clear dependence can be seen. See Sect. 3.2 in detail.
Current usage metrics show cumulative count of Article Views (full-text article views including HTML views, PDF and ePub downloads, according to the available data) and Abstracts Views on Vision4Press platform.
Data correspond to usage on the plateform after 2015. The current usage metrics is available 48-96 hours after online publication and is updated daily on week days.
Initial download of the metrics may take a while.