Fig. 11
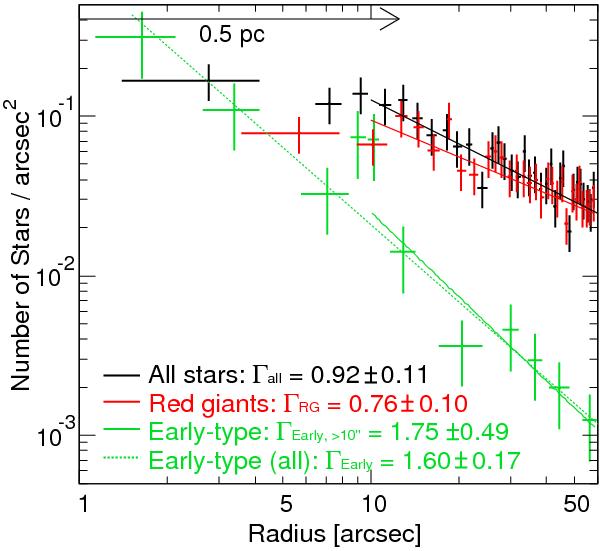
Plots of the azimuthally averaged, stellar surface number densities as a function of projected distance from Sgr A* for all stars in our sample (black), red giants (red), and early-type star candidates (green), with 9.75 < [2.25] < 12.25. The densities were determined in annuli of variable width, chosen such that each one contained a fixed number of stars (5 stars for the early-type star candidates, and 15 stars for the entire sample and the red giants). Data points at 10″ ≤ RSgrA∗ ≤ 60″ were used for power-law fits of the radial profiles for our entire sample (black line), red giants (red line), and early-type star candidates (green line). The green dashed line represents a power-law fit to the densities of the early type candidates, including those at RSgrA∗ ≤ 10″.
Current usage metrics show cumulative count of Article Views (full-text article views including HTML views, PDF and ePub downloads, according to the available data) and Abstracts Views on Vision4Press platform.
Data correspond to usage on the plateform after 2015. The current usage metrics is available 48-96 hours after online publication and is updated daily on week days.
Initial download of the metrics may take a while.