Fig. 10
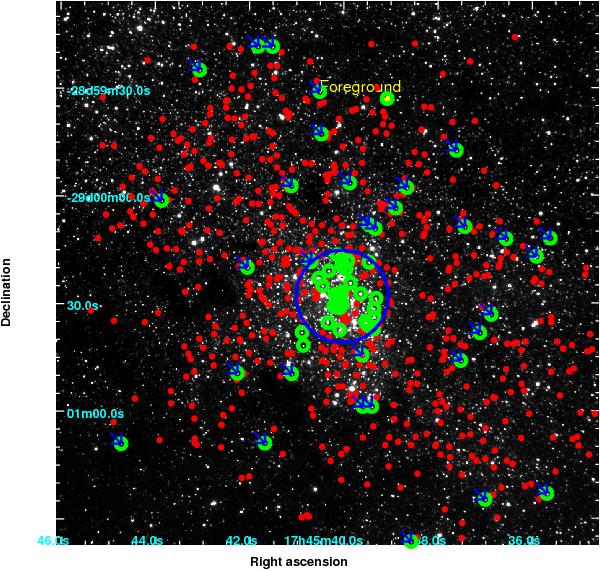
Spatial distribution of the early-type star candidates with 9.75 < [2.25] < 12.25 (green circles) within the FOV of our observations. The candidates which have been unknown so far are indicated by blue arrows. Red giants identified by our analysis are marked by red circles. The large blue circle delimits a region within 0.5 pc (12 9) in projection from Sgr A*. There is a strong concentration of the early-type star candidates in the central 0.5 pc, as already known from previous studies. In addition, we have identified about 30 new candidates outside the 0.5 pc region. Note that the density of classified sources decreases strongly toward the north-eastern, north-western, and south-eastern corners due to unreliable photometry in these regions, caused by strong PSF variability.
Current usage metrics show cumulative count of Article Views (full-text article views including HTML views, PDF and ePub downloads, according to the available data) and Abstracts Views on Vision4Press platform.
Data correspond to usage on the plateform after 2015. The current usage metrics is available 48-96 hours after online publication and is updated daily on week days.
Initial download of the metrics may take a while.