Fig. 7
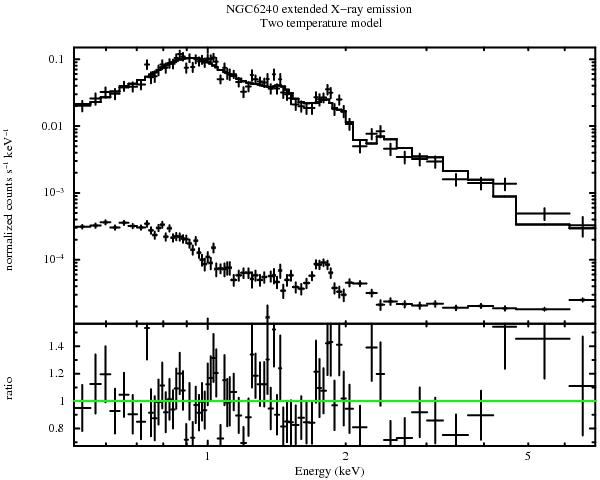
Top panel: the top curve represents the background corrected Chandra spectrum (uncorrected for the response of the instrument; crosses denote spectral widths and amplitude uncertainties) extracted at the position of Hα filaments (see Fig. 6), and fitted with a two-temperature thermal equilibrium model (solid line). The lower curve represents the background spectrum. Data, represented by crosses, have been binned to give a signal-to-noise ratio >5 in each bin (for plotting purposes only). Bottom panel: the data-to-model ratio (the green solid line representing a ratio of unity), showing the residuals at about 1 keV, 1.4 keV, 1.8 keV, 2.2 keV, and 5 keV.
Current usage metrics show cumulative count of Article Views (full-text article views including HTML views, PDF and ePub downloads, according to the available data) and Abstracts Views on Vision4Press platform.
Data correspond to usage on the plateform after 2015. The current usage metrics is available 48-96 hours after online publication and is updated daily on week days.
Initial download of the metrics may take a while.