Free Access
Fig. 5
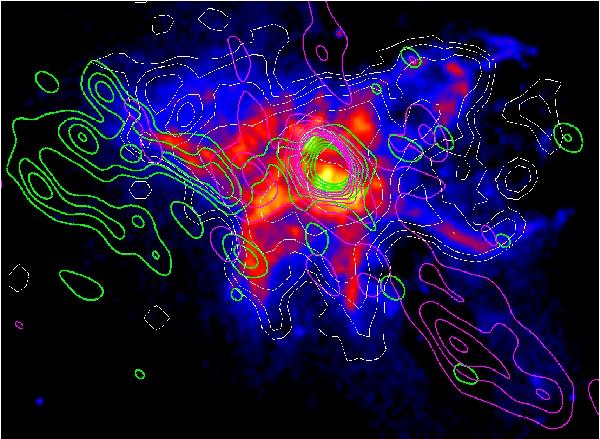
Hα map of NGC 6240 (color image). CO(1–0) emission at different velocities: −350 km s-1 (green contours), −100 km s-1 (magenta contours), with respect to the system velocity. Contours are calculated by merging D and A configuration data. Chandra 1.6–2 keV emission is shown by white contours.
Current usage metrics show cumulative count of Article Views (full-text article views including HTML views, PDF and ePub downloads, according to the available data) and Abstracts Views on Vision4Press platform.
Data correspond to usage on the plateform after 2015. The current usage metrics is available 48-96 hours after online publication and is updated daily on week days.
Initial download of the metrics may take a while.