Fig. 3
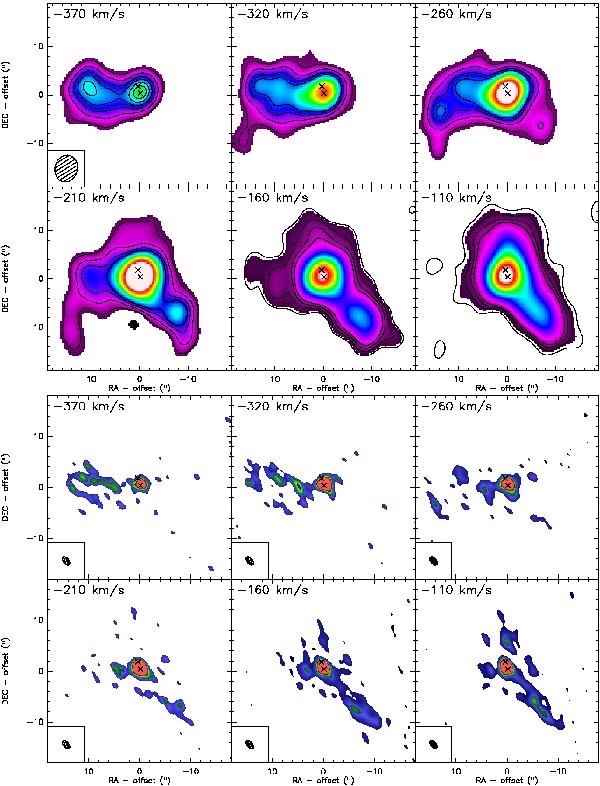
Upper panel: CO(1–0) maps from the compact array data, in velocity bins of 20 MHz each (velocity labels are rounded off), showing the detection of blueshifted CO, including structures extended on scales of 10–15′′. The positions of the two AGN nuclei are shown by crosses. The synthesized beam is shown in only the first panel, for clarity. Each contour is 5σ (limited to 20σ). Lower panel: maps from merged data of the D and A configurations in the same velocity channels. The synthesized beams are shown in the bottom-left corners.
Current usage metrics show cumulative count of Article Views (full-text article views including HTML views, PDF and ePub downloads, according to the available data) and Abstracts Views on Vision4Press platform.
Data correspond to usage on the plateform after 2015. The current usage metrics is available 48-96 hours after online publication and is updated daily on week days.
Initial download of the metrics may take a while.