Fig. 2
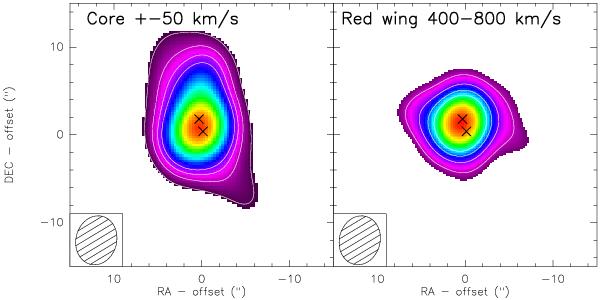
Maps of the CO core emission (left panel, −50, +50 km s-1) and red wing emission (right panel 400 to 800 km s-1 with respect to the systemic velocity), from the compact D array data. Each contour is 5σ (limited to 20σ). The positions of the two AGN nuclei are shown by crosses. The synthesized beam is shown in the bottom-left corners.
Current usage metrics show cumulative count of Article Views (full-text article views including HTML views, PDF and ePub downloads, according to the available data) and Abstracts Views on Vision4Press platform.
Data correspond to usage on the plateform after 2015. The current usage metrics is available 48-96 hours after online publication and is updated daily on week days.
Initial download of the metrics may take a while.