Fig. 6
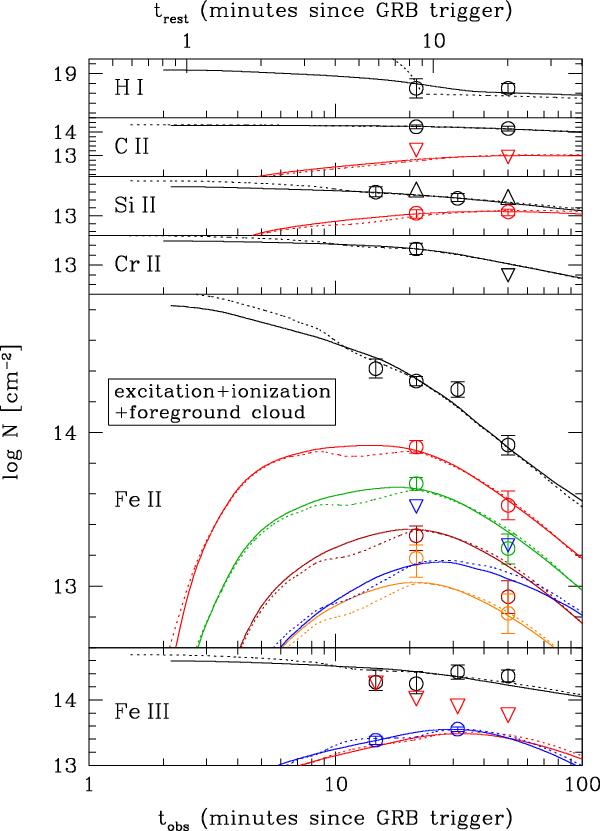
Same as Fig. 5, but including a foreground cloud situated between the GRB and the observed absorber. The solid and dotted lines correspond to the best-fitting model, assuming the default and Littlejohns input flux, respectively. The foreground absorber is mostly ionized by the time of the second epoch UVES spectrum and can therefore escape a clear detection. See the text and Table 3 for more details.
Current usage metrics show cumulative count of Article Views (full-text article views including HTML views, PDF and ePub downloads, according to the available data) and Abstracts Views on Vision4Press platform.
Data correspond to usage on the plateform after 2015. The current usage metrics is available 48-96 hours after online publication and is updated daily on week days.
Initial download of the metrics may take a while.