Fig. 4
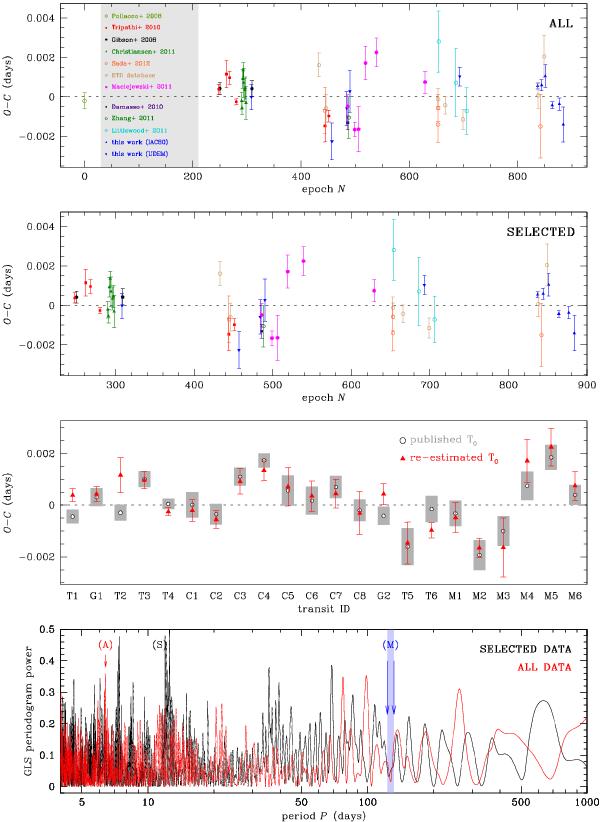
First panel from the top: O − C diagram for all data points tabulated in Table 3. Second panel: same as above for points selected as in the last column of Table 3. Third panel: comparison between the original T0 published by the respective authors (white circles with gray error bars; Table 1) and as re-estimated in this work (red triangles and bars) for the subset of high-precision light curves identified in the horizontal axis. Fourth panel: GLS periodogram for the complete sample (red line, highest peak at A) and the selected sample (black line, highest peak at S). The periodicity claimed by Maciejewski et al. (2010) is marked with the M label.
Current usage metrics show cumulative count of Article Views (full-text article views including HTML views, PDF and ePub downloads, according to the available data) and Abstracts Views on Vision4Press platform.
Data correspond to usage on the plateform after 2015. The current usage metrics is available 48-96 hours after online publication and is updated daily on week days.
Initial download of the metrics may take a while.