Fig. 3
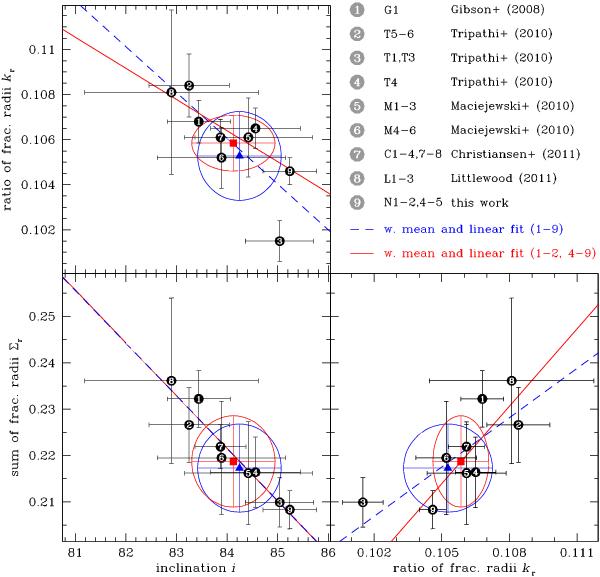
Geometrical parameters of WASP-3b estimated from individual data (sub-)sets (Table 2) plotted as black labeled circles in their two-dimensional parameter space to highlight the sizeable correlation between Σr, kr, and i. The blue dashed line in each plot is a weighted linear fit of all points; the blue triangles and the associated error ellipse correspond to the weighted mean ± 1σ computed on the marginal distribution of Σr, kr, and i (last but one row of Table 2). The red continuous line and squares are computed in the same way as the blue ones, but after removing the outlier labeled “3” from the set (T1,T3; last row of Table 2).
Current usage metrics show cumulative count of Article Views (full-text article views including HTML views, PDF and ePub downloads, according to the available data) and Abstracts Views on Vision4Press platform.
Data correspond to usage on the plateform after 2015. The current usage metrics is available 48-96 hours after online publication and is updated daily on week days.
Initial download of the metrics may take a while.