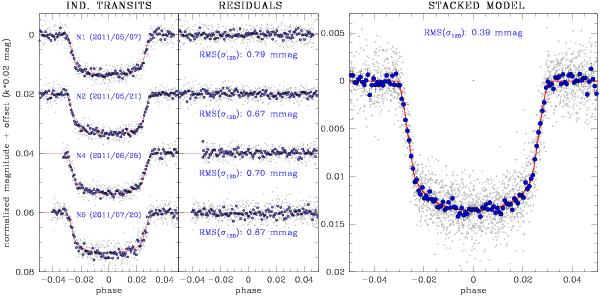
Fig. 2

Construction of the best-fit model from the four best light curves of WASP-3b observed at IAC80 (on 2011 May 7, May 21, Jun. 26, Jul. 20). The ID# of each transit (N1, N2, N4, N5) matches the corresponding entry in Table 1. Small gray dots represent the data points with the original cadence, while blue circles are binned on 120 s intervals. The red line is the best-fit from JKTEBOP (Table 2). Left panel: individual light curves. Transits are offset in magnitude by a multiple of 0.02 for clarity. Middle panel: residuals from the best-fit model. The reported scatter is evaluated on the binned points as the 68.27th percentile from the median value. Right panel: stack of all four IAC80 light curves with the best-fit model superimposed. The derived parameters are quoted in Table 2.
Current usage metrics show cumulative count of Article Views (full-text article views including HTML views, PDF and ePub downloads, according to the available data) and Abstracts Views on Vision4Press platform.
Data correspond to usage on the plateform after 2015. The current usage metrics is available 48-96 hours after online publication and is updated daily on week days.
Initial download of the metrics may take a while.


