Fig. 1
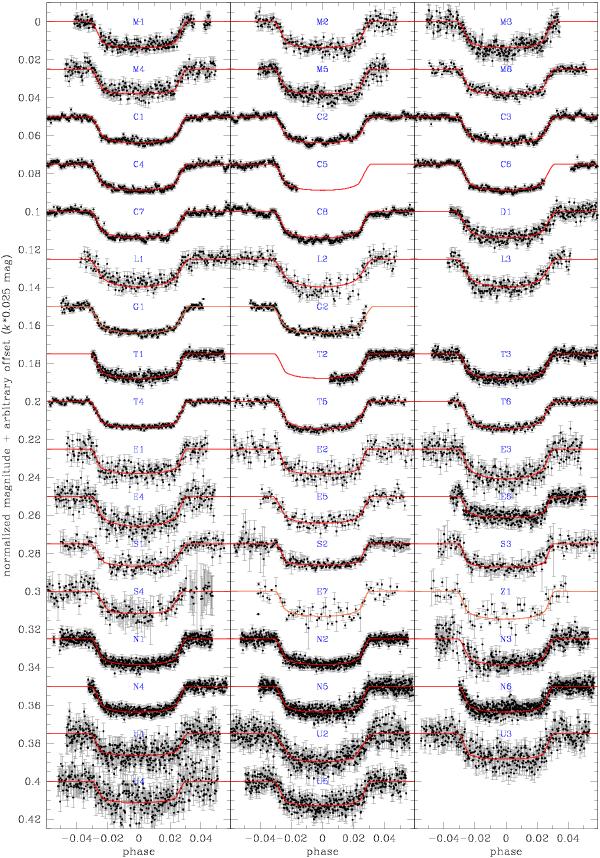
Light curves of WASP-3b. The ID code of each transit matches the corresponding entry in Table 1. Data points are plotted with the original cadence, except for G1/G2 and Z1/E7, which are binned on 30 s and 300 s intervals for clarity, respectively. The red line is the best-fit model found by JKTEBOP. Transits are offset in magnitude by integer multiples of 0.025.
Current usage metrics show cumulative count of Article Views (full-text article views including HTML views, PDF and ePub downloads, according to the available data) and Abstracts Views on Vision4Press platform.
Data correspond to usage on the plateform after 2015. The current usage metrics is available 48-96 hours after online publication and is updated daily on week days.
Initial download of the metrics may take a while.