Fig. 6
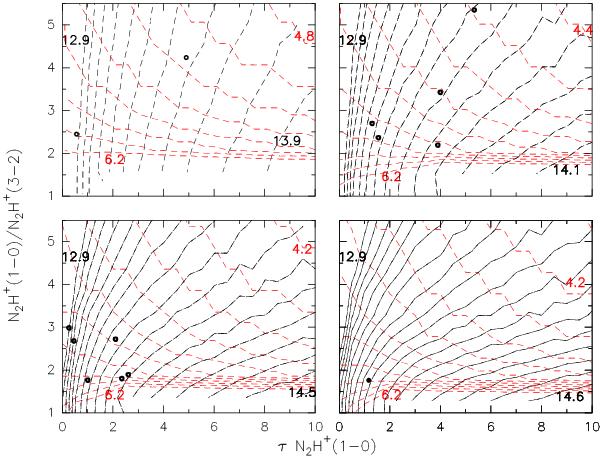
N2H+(1–0) optical depth versus the ratio of N2H+(1–0) and N2H+(3–2) integrated intensities. The four plots represent RADEX calculations with different temperatures: top left 10 K; top right 15 K; bottom left 20 K; bottom right 25 K. The black dashed contours represent the logarithm of the line width times the column density, log (NN2H+/Δv) with a contour step of 0.1. The red dashed contours are log (nH2) with a contour step of 0.2. The lowest and highest contour values are given in each plot. The values of the sources in Table 4 are plotted by black dots.
Current usage metrics show cumulative count of Article Views (full-text article views including HTML views, PDF and ePub downloads, according to the available data) and Abstracts Views on Vision4Press platform.
Data correspond to usage on the plateform after 2015. The current usage metrics is available 48-96 hours after online publication and is updated daily on week days.
Initial download of the metrics may take a while.