Fig. 8
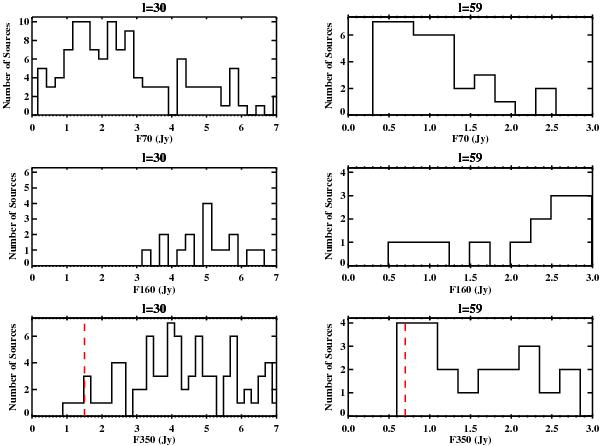
Distribution of the candidate YSOs 70 μm, 160 μm, and 350 μm fluxes in the SDP fields. These bands are particularly important because the 70 μm fluxes are used to indicate star formation activity, the 160 μm is located in the peak of the SED, and the 350 μm fluxes determine the masses through Eq. (3). The vertical red-dashed lines in the bottom panels indicate the sensitivity limit used to calculate the completeness of our sample. They correspond to 1.5 and 0.7 Jy in ℓ = 30° and ℓ = 59°, respectively.
Current usage metrics show cumulative count of Article Views (full-text article views including HTML views, PDF and ePub downloads, according to the available data) and Abstracts Views on Vision4Press platform.
Data correspond to usage on the plateform after 2015. The current usage metrics is available 48-96 hours after online publication and is updated daily on week days.
Initial download of the metrics may take a while.