Free Access
Fig. 7
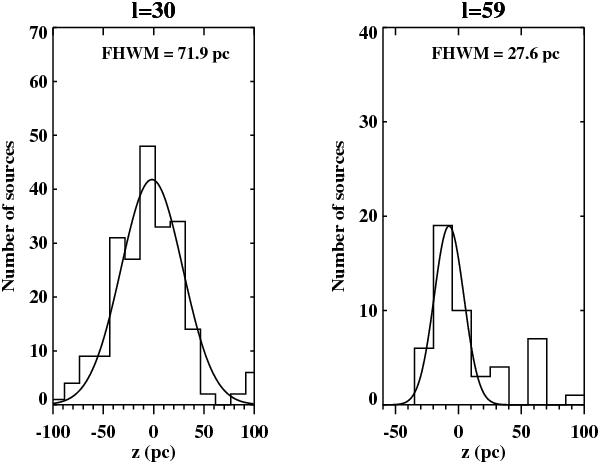
z distribution of the Hi-GAL protostars in the ℓ = 30° and ℓ = 59° fields. The z value adopted to estimate the tile volumes is the FWHM of the Gaussian fit. The second peak at z ~ 60 pc in ℓ = 59° is due to a concentration of YSOs in the Vulpecula OB association (Billot et al. 2010).
Current usage metrics show cumulative count of Article Views (full-text article views including HTML views, PDF and ePub downloads, according to the available data) and Abstracts Views on Vision4Press platform.
Data correspond to usage on the plateform after 2015. The current usage metrics is available 48-96 hours after online publication and is updated daily on week days.
Initial download of the metrics may take a while.