Fig. 6
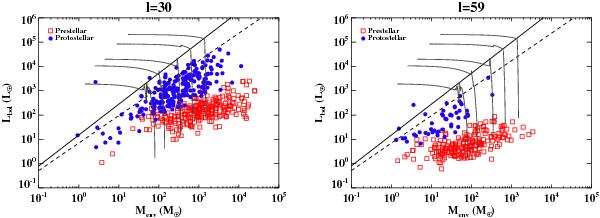
Menv − Lbol diagram of the sources in the ℓ = 30° (left panel) and ℓ = 59° (right panel) fields for the prestellar and protostellar cores shown in Fig. 2. The solid black line and the dashed black line are the best log-log fit of the high-mass counterparts of the Class I and Class 0 sources, respectively, in the low-mass regime, as found in Molinari et al. (2008).
Current usage metrics show cumulative count of Article Views (full-text article views including HTML views, PDF and ePub downloads, according to the available data) and Abstracts Views on Vision4Press platform.
Data correspond to usage on the plateform after 2015. The current usage metrics is available 48-96 hours after online publication and is updated daily on week days.
Initial download of the metrics may take a while.