Fig. B.1
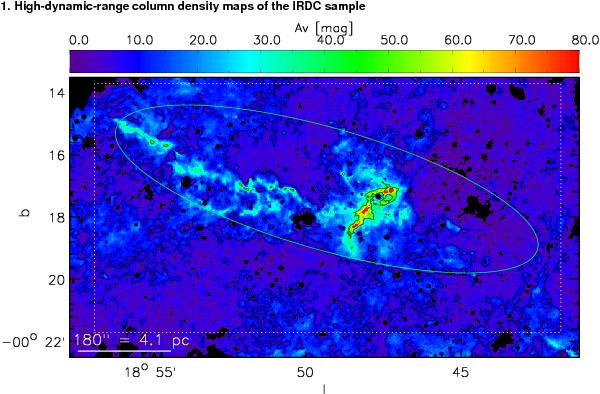
High-dynamic-range column density map of the cloud A, derived using a combination of MIR and NIR data. The green circle shows the largest ellipse from the Simon et al. (2006) catalog in the region. The white box outlines the region which was used alongside with the AV = 7 mag contour to define the region that is included in the analyses presented in Sect. 4. The contours are drawn at AV = [7,40] mag. The scale bar shows the physical scale assuming the distance as given in Table 1.
Current usage metrics show cumulative count of Article Views (full-text article views including HTML views, PDF and ePub downloads, according to the available data) and Abstracts Views on Vision4Press platform.
Data correspond to usage on the plateform after 2015. The current usage metrics is available 48-96 hours after online publication and is updated daily on week days.
Initial download of the metrics may take a while.