Free Access
Fig. A.2
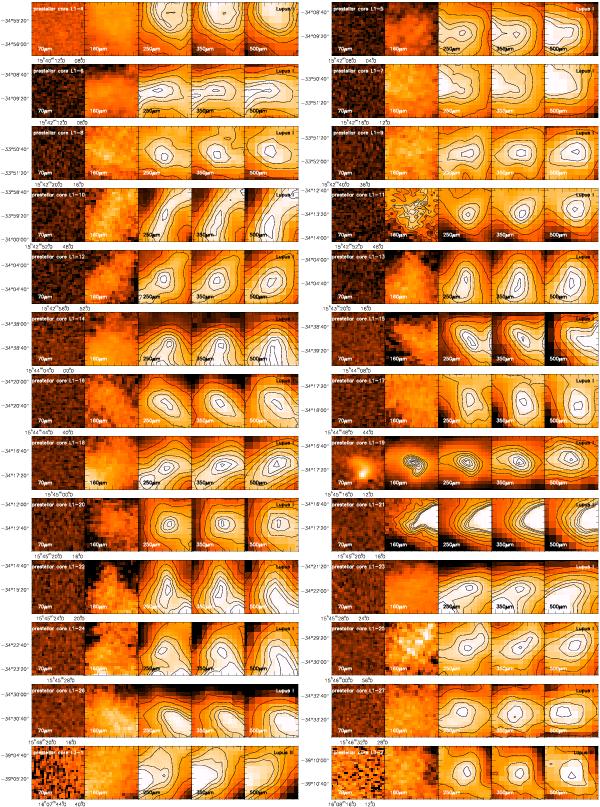
Visual catalog of the prestellar cores (contour levels are peakflux ∗ 0.99, 0.95, 0.90, 0.80, 0.70, 0.60, and 0.50) and Class 0 objects in the three Lupus clouds (I, III, IV), continued from Fig. 2. The maps are centered on the prestellar core/Class 0 object and are ordered per cloud by right ascension.
This figure is made of several images, please see below:


Current usage metrics show cumulative count of Article Views (full-text article views including HTML views, PDF and ePub downloads, according to the available data) and Abstracts Views on Vision4Press platform.
Data correspond to usage on the plateform after 2015. The current usage metrics is available 48-96 hours after online publication and is updated daily on week days.
Initial download of the metrics may take a while.