Free Access
Fig. 4
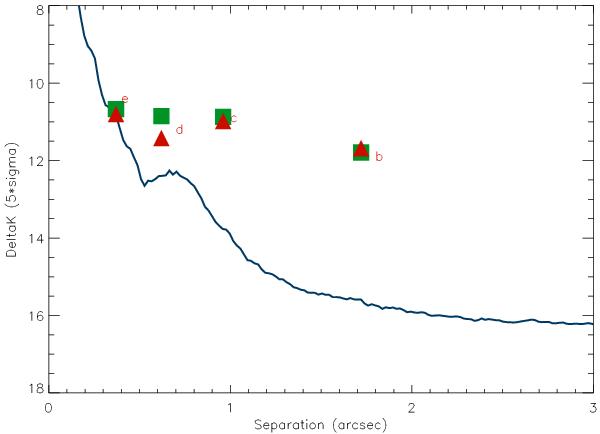
5σ contrast plot expressed in magnitudes for the Ks-band data. Overplotted are our own measurements for the four HR 8799 planets (red triangles) and the corresponding measurements from Marois et al. (2008) as green squares.
Current usage metrics show cumulative count of Article Views (full-text article views including HTML views, PDF and ePub downloads, according to the available data) and Abstracts Views on Vision4Press platform.
Data correspond to usage on the plateform after 2015. The current usage metrics is available 48-96 hours after online publication and is updated daily on week days.
Initial download of the metrics may take a while.