Fig. 3
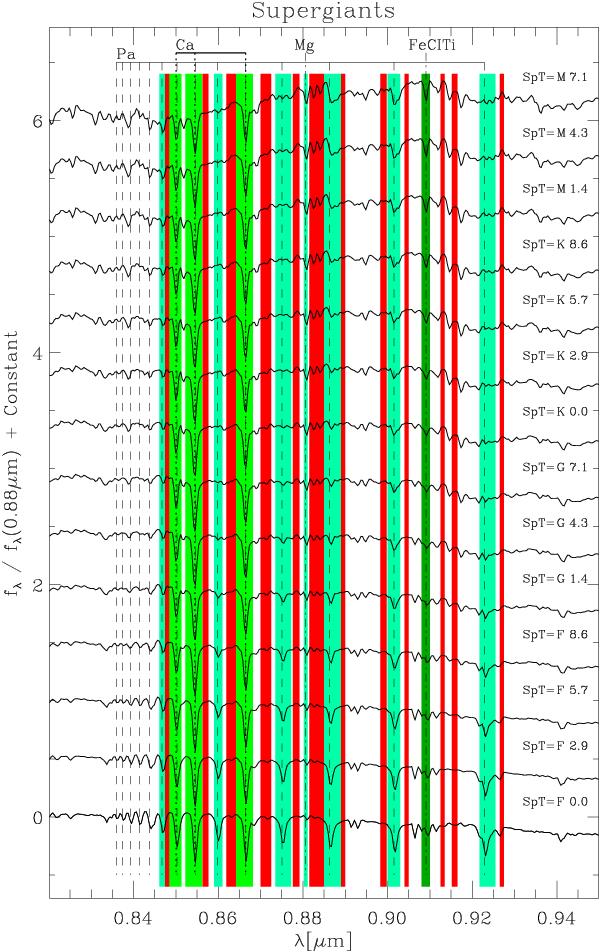
I-band model spectrum of supergiant stars obtained by fitting at each wavelength the flux-normalized (at 0.88 μm) sample spectra along SpTs. The model spectrum for different SpTs is offset for displaying purposes and the SpT is given. The green and red regions mark the bandpasses of the newly defined indices and their adjacent continuum, respectively (see Table 1). In particular the light green, green and dark green regions mark the Pa, Ca, Mg and FeClTe features, respectively. Some relevant absorption features are marked.
Current usage metrics show cumulative count of Article Views (full-text article views including HTML views, PDF and ePub downloads, according to the available data) and Abstracts Views on Vision4Press platform.
Data correspond to usage on the plateform after 2015. The current usage metrics is available 48-96 hours after online publication and is updated daily on week days.
Initial download of the metrics may take a while.