Fig. 3
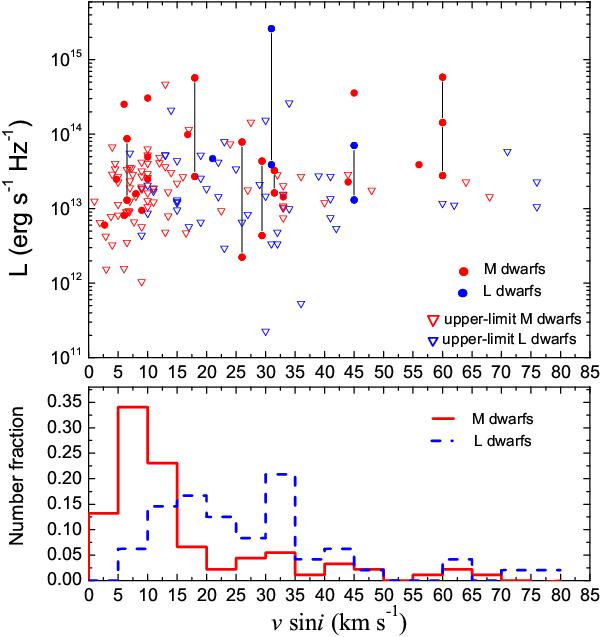
Top panel: radio luminosity as a function of rotation velocity for the UCDs observed in the radio domain (mainly at 4.9 and 8.5 GHz). Red solid circles are for M dwarfs, the blue solid circles represent L dwarfs. The solid circles connected by black lines denote different measurements for the same target. Red open triangles denote the upper-limit of the luminosity of M dwarfs; blue open triangles stand for the upper-limit of the luminosity of L dwarfs. The data are mainly taken from Table 1, McLean et al. (2012), and references therein. Bottom panel: the number distribution of the observed dwarfs as a function of rotation velocity. The red solid line is for M dwarfs (normalized by the total number 91), the blue dashed line is for L dwarfs (normalized by the total number 48).
Current usage metrics show cumulative count of Article Views (full-text article views including HTML views, PDF and ePub downloads, according to the available data) and Abstracts Views on Vision4Press platform.
Data correspond to usage on the plateform after 2015. The current usage metrics is available 48-96 hours after online publication and is updated daily on week days.
Initial download of the metrics may take a while.