Fig. 1
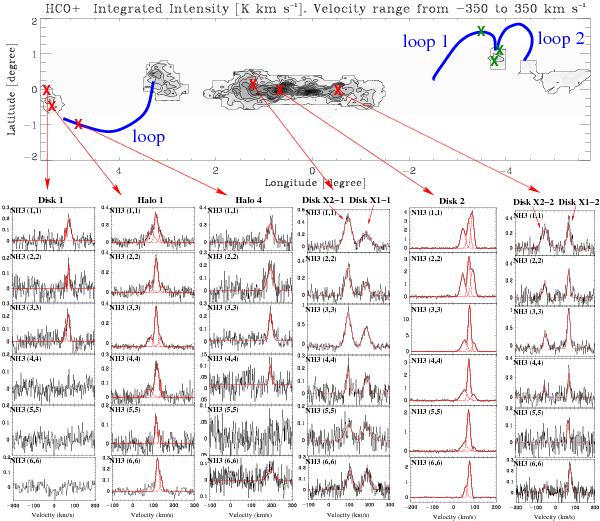
Spectra toward selected positions in the GC in the metastable inversion transitions from (1, 1) to (6, 6) of NH3. The positions are indicated in the HCO+ integrated intensity map from Riquelme et al. (2010b). The GMLs found by Fukui et al. (2006) are indicated in blue. The positions that could not seen from Effelsberg are indicated with green crosses. As indicated in Table 1, our Disk 2 position corresponds to Sgr B2.
Current usage metrics show cumulative count of Article Views (full-text article views including HTML views, PDF and ePub downloads, according to the available data) and Abstracts Views on Vision4Press platform.
Data correspond to usage on the plateform after 2015. The current usage metrics is available 48-96 hours after online publication and is updated daily on week days.
Initial download of the metrics may take a while.