| Issue |
A&A
Volume 549, January 2013
|
|
|---|---|---|
| Article Number | A36 | |
| Number of page(s) | 28 | |
| Section | Interstellar and circumstellar matter | |
| DOI | https://doi.org/10.1051/0004-6361/201118288 | |
| Published online | 13 December 2012 | |
Online material
Appendix A: Complementary tables
Fractional abundances of NH3 with respect to SiO, HNCO, CS, C34S, and of SiO and HNCO with respect to CS and C34S.
Estimation of heating and cooling rates for each source.
Column density derived for NH3 (3, 3) and NH3 (6, 6) using RADEX.
Results from Gaussian fit and optical depth from NH3 method.
Gaussian fits and column densities for SiO, C34S, HNCO.
Appendix B: Complementary figures
This appendix presents the LVG diagrams of the metastable inversion transitions of para-NH3. Most of the sources show two kinetic temperature components: one warm plotted in a red line; and one cool plotted in a blue line. In the cases where only the warm kinetic temperature component was present, the result is showed with a red line. We show the n(H2) derived for each component from the CS data, which was used as a fixed parameter in the RADEX program. The shaded regions correspond to the error associated to each para-NH3 line. When a line was not detected we plot their 3 − σ level with a dashed line. The error associated to the kinetic temperature and column density was estimated computing the χ2 of the line intensities over the grid used for the LVG model. We impose 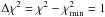 , which translates in the 68.3% confidence level projected for each parameter axis, which is showed as a black elipse.
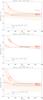 |
Fig. B.1
LVG diagrams of NH3 for each velocity component of Halo 1. Top: 87.7 km s-1. Middle: 117.2 km s-1. Bottom: 138.6 km s-1. |
| Open with DEXTER | |
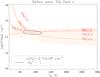 |
Fig. B.2
LVG diagram of NH3 for Halo 4. |
| Open with DEXTER | |
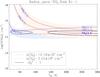 |
Fig. B.3
LVG diagram of NH3 for Disk X1-1. The blue lines correspond to the low-temperature regimen, and the red lines to the high-temperature regimen. |
| Open with DEXTER | |
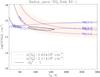 |
Fig. B.4
LVG diagram of NH3 for Disk X2-1. The blue lines correspond to the low-temperature regimen, and the red lines to the high-temperature regimen. |
| Open with DEXTER | |
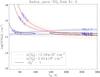 |
Fig. B.5
LVG diagram of NH3 for Disk X1-2. The blue lines correspond to the low-temperature regimen, and the red lines to the high-temperature regimen. |
| Open with DEXTER | |
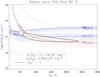 |
Fig. B.6
LVG diagram of NH3 for Disk X2-2. The blue lines correspond to the low-temperature regimen, and the red lines to the high-temperature regimen. |
| Open with DEXTER | |
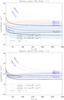 |
Fig. B.7
LVG diagrams of NH3 for each velocity component of Disk 1. Top: 56.5 km s-1. Bottom: 72.4 km s-1. The blue lines correspond to the low-temperature regimen, and the red lines to the high-temperature regimen. |
| Open with DEXTER | |
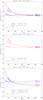 |
Fig. B.8
LVG diagrams of NH3 for each velocity component of Disk 2. Top: 48.8 km s-1. Middle: 74.5 km s-1. Bottom: 95.8 km s-1. The blue lines correspond to the low-temperature regimen, and the red lines to the high-temperature regimen. |
| Open with DEXTER | |
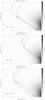 |
Fig. B.9
LVG diagrams of CS for each velocity component (defined by the J = 2−1 CS) of Halo 1 (see Table A.5). Top: 83.8 km s-1. Middle: 117.4 km s-1. Bottom: 136.9 km s-1. The Tkin is indicated in the lower left corner in each plot. |
| Open with DEXTER | |
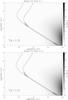 |
Fig. B.10
LVG diagrams of CS for each velocity component of Halo 2. Top: −80 km s-1. Bottom: −51.9 km s-1. |
| Open with DEXTER | |
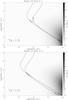 |
Fig. B.11
LVG diagrams of CS for each velocity component of Halo 3. Top: −64.7 km s-1. Bottom: −13.9 km s-1. |
| Open with DEXTER | |
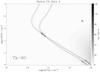 |
Fig. B.12
LVG diagrams of CS for Halo 4. |
| Open with DEXTER | |
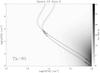 |
Fig. B.13
LVG diagrams of CS for Halo 5. |
| Open with DEXTER | |
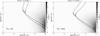 |
Fig. B.14
LVG diagrams of CS for each kinetic temperature regime of Disk X1-1. |
| Open with DEXTER | |
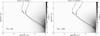 |
Fig. B.15
LVG diagrams of CS for each kinetic temperature regime of Disk X2-1. |
| Open with DEXTER | |
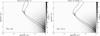 |
Fig. B.16
LVG diagrams of CS for each kinetic temperature regime of Disk X1-2. |
| Open with DEXTER | |
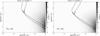 |
Fig. B.17
LVG diagrams of CS for each kinetic temperature regime of Disk X2-2. |
| Open with DEXTER | |
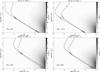 |
Fig. B.18
LVG diagrams of CS for each kinetic temperature regime, for each velocity component of Disk 1. Top: 56.8 km s-1. Bottom: 74.9 km s-1. |
| Open with DEXTER | |
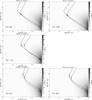 |
Fig. B.19
LVG diagrams of CS for each kinetic temperature regime, for each velocity component of Disk 2. Top: 14.2 km s-1. Middle: 55.9 km s-1. Bottom: 79.0 km s-1. |
| Open with DEXTER | |
© ESO, 2012
Current usage metrics show cumulative count of Article Views (full-text article views including HTML views, PDF and ePub downloads, according to the available data) and Abstracts Views on Vision4Press platform.
Data correspond to usage on the plateform after 2015. The current usage metrics is available 48-96 hours after online publication and is updated daily on week days.
Initial download of the metrics may take a while.