Fig. 7
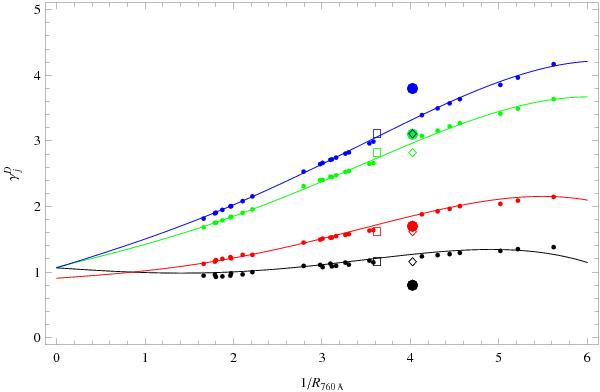
Comparison of explicitly fitted  for HCO (black), CH2 (red), CN (green), and N2 (blue) for all dust models from Weingartner & Draine (2001b,their Table 1) with scaling relationship Eq. (16). The large points show the original values of γj from UDfA, the open diamonds show the values calculated using an MRN dust model, and the open squares denote the explicitly calculated values assuming
  .
.
Current usage metrics show cumulative count of Article Views (full-text article views including HTML views, PDF and ePub downloads, according to the available data) and Abstracts Views on Vision4Press platform.
Data correspond to usage on the plateform after 2015. The current usage metrics is available 48-96 hours after online publication and is updated daily on week days.
Initial download of the metrics may take a while.