Fig. B.3
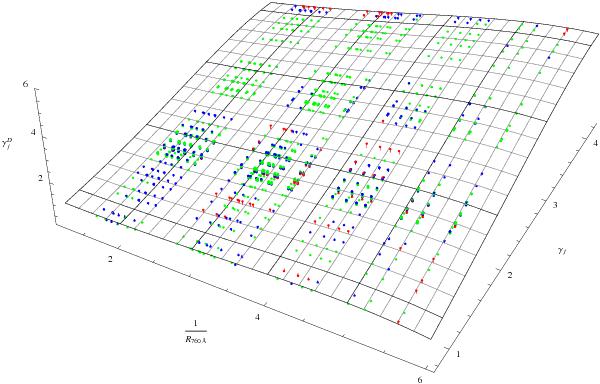
Visualization of Eq. (16) (black grid) and the explicitly calculated fits  (colored dots) for the 25 WD01 dust models for all species with available cross sections. The data points are colored according to their deviation from Eq. (16). Green and blue denotes deviations of less than 0.05 and 0.1. Red points signal deviations exceeding 0.1. All deviations are smaller than 0.22.
Current usage metrics show cumulative count of Article Views (full-text article views including HTML views, PDF and ePub downloads, according to the available data) and Abstracts Views on Vision4Press platform.
Data correspond to usage on the plateform after 2015. The current usage metrics is available 48-96 hours after online publication and is updated daily on week days.
Initial download of the metrics may take a while.