Fig. B.1
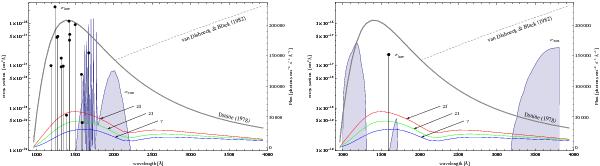
Wavelength dependence of the assumed UV illumination and the photo-dissociation cross sections. The thick black line shows the unshielded empty-space Draine FUV field, the dashed line shows an extension of the Draine field longward of 2000 Å suggested by van Dishoeck & Black (1982). The blue, green and red lines show the FUV radiation field inside the reference cloud at 95% Rtot for the WD01-7, WD01-21, and WD01-25 dust models, respectively. Left panel: the blue filled curve shows the continuum absorption cross section σcont of CH2 that leads to dissociation, the black dots with drop lines show the corresponding line absorption cross section σline. Right panel: same as left panel but for the SiH+ photo-dissociation cross sections.
Current usage metrics show cumulative count of Article Views (full-text article views including HTML views, PDF and ePub downloads, according to the available data) and Abstracts Views on Vision4Press platform.
Data correspond to usage on the plateform after 2015. The current usage metrics is available 48-96 hours after online publication and is updated daily on week days.
Initial download of the metrics may take a while.