Fig. A.1
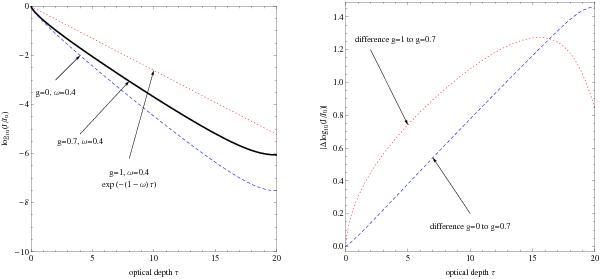
Left panel: mean intensity versus optical depth τ normalized to the incident specific intensity I0. The solid black curve shows the depth dependence of the mean intensity assuming dust parameters ω = 0.4, g = 0.7, approximately describing the WD01-7 dust sort. The dashed and dotted curves denote mean intensities using the same albedo ω, but assuming isotropic and pure forward-scattering, respectively. Right panel: absolute error | log (Ji/I0) − log (Jk/I0) | of assuming isotropic g = 0 and pure forward-scattering g = 1 with respect to more realistic values ω = 0.4, g = 0.7 (dashed and dotted lines, respectively).
Current usage metrics show cumulative count of Article Views (full-text article views including HTML views, PDF and ePub downloads, according to the available data) and Abstracts Views on Vision4Press platform.
Data correspond to usage on the plateform after 2015. The current usage metrics is available 48-96 hours after online publication and is updated daily on week days.
Initial download of the metrics may take a while.