Free Access
Fig. 22
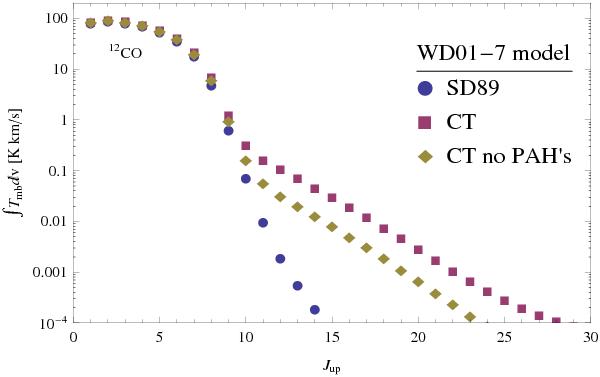
Total line integrated clump-averaged intensities of 12CO transitions for a model clump of M = 10 M⊙, n = 105 cm-3, and χ = 1000. The different lines show the effect of different H2 formation treatment. All models were computed using the WD01-7 dust properties regarding the radiative transfer and the PE heating.
Current usage metrics show cumulative count of Article Views (full-text article views including HTML views, PDF and ePub downloads, according to the available data) and Abstracts Views on Vision4Press platform.
Data correspond to usage on the plateform after 2015. The current usage metrics is available 48-96 hours after online publication and is updated daily on week days.
Initial download of the metrics may take a while.