Fig. 20
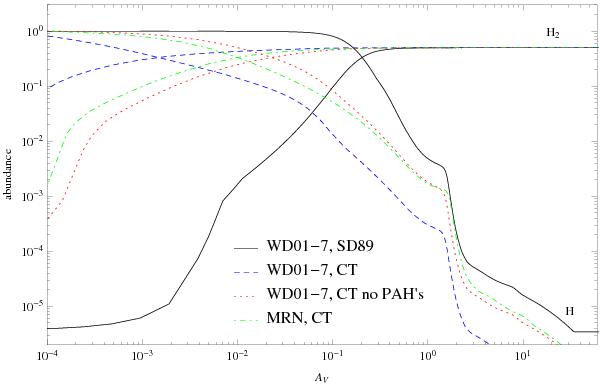
H and H2 abundances for a model clump of M = 10 M⊙, n = 105 cm-3, and χ = 1000. The different lines denote different treatments of the H2 formation. The solid line shows a model using the standard H2 formation rate as given by Sternberg & Dalgarno (1989). The dashed and dotted lines show model results for H2 formation according to CT where the formation on PAH surfaces is switched on and off, respectively. All three models assume a WD01-7 dust distribution. The green dash-dotted line assumes an MRN dust model and uses the CT H2 formation.
Current usage metrics show cumulative count of Article Views (full-text article views including HTML views, PDF and ePub downloads, according to the available data) and Abstracts Views on Vision4Press platform.
Data correspond to usage on the plateform after 2015. The current usage metrics is available 48-96 hours after online publication and is updated daily on week days.
Initial download of the metrics may take a while.