Fig. 2
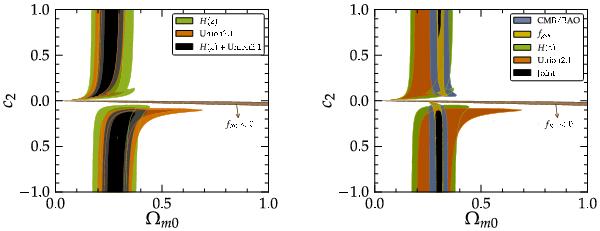
(left) Contours of Δχ2 = 2.3 and Δχ2 = 6.17 in the Ωm0 × c2 plane arising from SNe Ia Union2.1 sample (Suzuki et al. 2012) (orange) and current H(z) data (Stern et al. 2010) (green). Black contours stand for the joint analysis involving these two sets of data. (right) Contours of Δχ2 = 6.17 in the Ωm0 × c2 plane when 7 measurements of the CMB/BAO ratio and 57 measurements of the gas mass fraction of galaxy clusters are added. We have also indicated the region fR0 < 0 corresponding to the bounds (11) for the best-fit values shown in Table 1.
Current usage metrics show cumulative count of Article Views (full-text article views including HTML views, PDF and ePub downloads, according to the available data) and Abstracts Views on Vision4Press platform.
Data correspond to usage on the plateform after 2015. The current usage metrics is available 48-96 hours after online publication and is updated daily on week days.
Initial download of the metrics may take a while.