Fig. 1
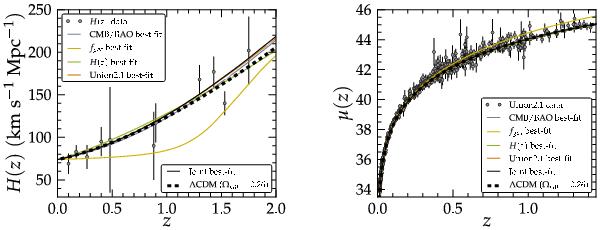
(left) Predicted Hubble evolution H(z) as a function of the redshift for the Hu-Sawicki model in the Palatini formalism (Eqs. (5)–(8)). The curves correspond to the best-fit values of Ωm0 and c2 discussed in the text. For the sake of comparison, the standard ΛCDM model prediction is also shown. The data points are the measurements of the H(z) given in Stern et al. (2010). (right) Hubble diagram for 580 SNe Ia from the Union2.1 sample (Suzuki et al. 2012). The curves correspond to the best-fit values of Ωm0 and c2 displayed in Table 1.
Current usage metrics show cumulative count of Article Views (full-text article views including HTML views, PDF and ePub downloads, according to the available data) and Abstracts Views on Vision4Press platform.
Data correspond to usage on the plateform after 2015. The current usage metrics is available 48-96 hours after online publication and is updated daily on week days.
Initial download of the metrics may take a while.