Fig. 6
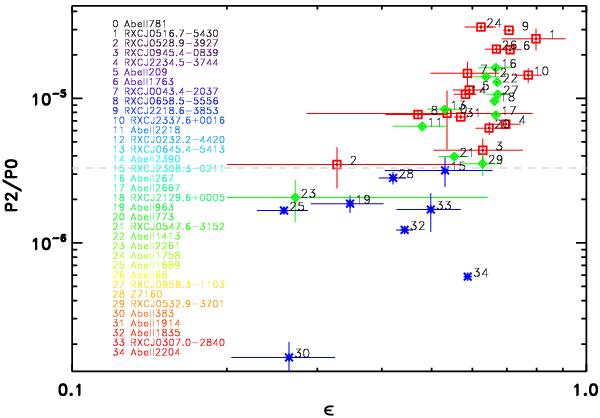
Comparison of P2 and the ellipticity, ϵ, calculated from a fit of an elliptical β model to the X-ray image. The blue stars represent those classified as regular, the green diamonds the intermediate, and the disturbed clusters are marked by the red squares. This convention is carried throughout the paper. There is a positive correlation between two parameters. We note that there is a segregation effect which separates regular clusters from the intermediate and disturbed ones.
Current usage metrics show cumulative count of Article Views (full-text article views including HTML views, PDF and ePub downloads, according to the available data) and Abstracts Views on Vision4Press platform.
Data correspond to usage on the plateform after 2015. The current usage metrics is available 48-96 hours after online publication and is updated daily on week days.
Initial download of the metrics may take a while.