Free Access
Fig. 2
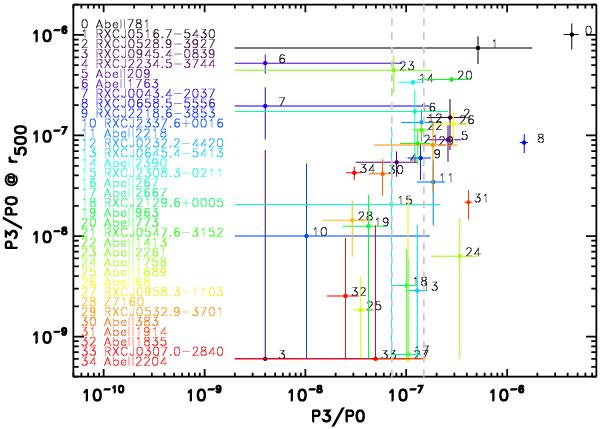
Comparison of P3 calculated at r500, and averaged over the ten rings. A general linear correlation can be seen with some scatter as expected. These two ways of calculating P3 values classify a number of clusters differently, see text for details.
Current usage metrics show cumulative count of Article Views (full-text article views including HTML views, PDF and ePub downloads, according to the available data) and Abstracts Views on Vision4Press platform.
Data correspond to usage on the plateform after 2015. The current usage metrics is available 48-96 hours after online publication and is updated daily on week days.
Initial download of the metrics may take a while.