Free Access
Fig. 12
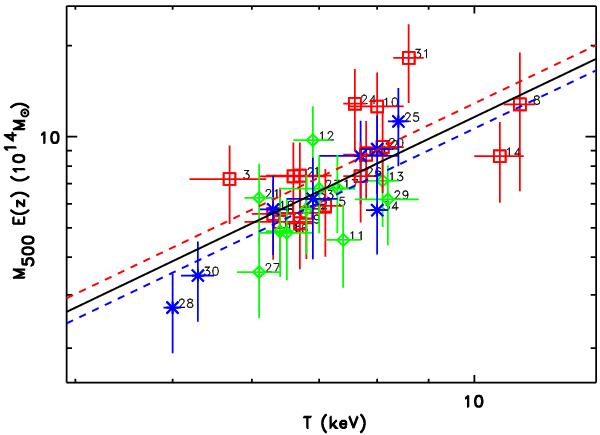
MX − T relation with the fitted results from the bisector method. The fitted lines follow the same notation as in Fig. 11. The two morphological groups move to the opposite sides from the best-fit of the 35 clusters. Disturbed clusters appear slightly more massive for a given temperature.
Current usage metrics show cumulative count of Article Views (full-text article views including HTML views, PDF and ePub downloads, according to the available data) and Abstracts Views on Vision4Press platform.
Data correspond to usage on the plateform after 2015. The current usage metrics is available 48-96 hours after online publication and is updated daily on week days.
Initial download of the metrics may take a while.